The short answer
An unshaded south roof at 35° in Congleton makes about 909 kWh a year per kWp; the best in our runs, south at 40°, makes 910. That is about 5.3% below Nantwich, the highest of the six towns we modelled. East and west roofs make about 81% and 80% of the best Congleton figure.
Every direction and pitch
A year’s output from 1 kWp at 53.163° N, 2.213° W, from PVGIS 5.3. For 4 kWp on a south roof at 35°, about 3,635 kWh.
| Roof faces | 10° | 20° | 30° | 35° | 40° | 45° | 50° |
|---|---|---|---|---|---|---|---|
| South | 830 | 876 | 903 | 909 | 910 | 906 | 898 |
| South-east | 812 | 843 | 860 | 863 | 860 | 854 | 844 |
| South-west | 810 | 839 | 854 | 855 | 853 | 845 | 835 |
| East | 765 | 758 | 745 | 736 | 725 | 710 | 694 |
| West | 762 | 752 | 737 | 727 | 715 | 700 | 683 |
| North-east | 715 | 661 | 608 | 583 | 558 | 533 | 508 |
| North-west | 713 | 657 | 603 | 578 | 553 | 529 | 504 |
| North | 693 | 620 | 546 | 509 | 473 | 437 | 403 |
Congleton against five other towns
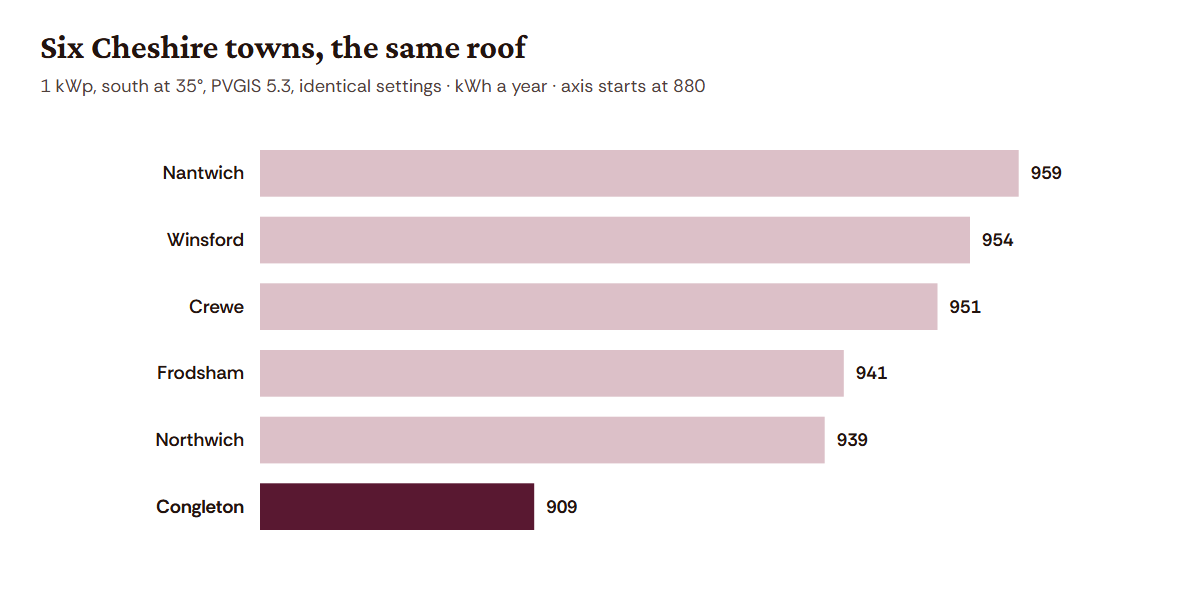
| Town | kWh per kWp | Against the highest |
|---|---|---|
| Nantwich | 959 | 100% |
| Winsford | 954 | 99.5% |
| Crewe | 951 | 99.1% |
| Frodsham | 941 | 98.1% |
| Northwich | 939 | 97.9% |
| Congleton | 909 | 94.7% |
We also ran Congleton with and without the terrain horizon: the hills to the east change the yearly figure by less than one kWh. The gap is in the sunlight record, not in shade from the land.
The sky, not the panels
PVGIS breaks its estimate into steps, and comparing them shows where Congleton’s shortfall comes from. Sunlight on a south-facing surface at 35° averages 1,122 kWh per square metre a year here (PVGIS 5.3). The losses after that are the ones every town in the table shares: about 3.3% from light glancing off the glass, 4.3% from heat and weak light, a 1.8% gain from the spectrum of the daylight, and our 14% allowance for wiring, the inverter and dirt. They take 19.0% off in all. Panels on a Congleton roof convert sunlight as well as panels anywhere else in the county; there is simply a little less sunlight in the record for this corner of it.
One good year closes the gap
The difference between towns is smaller than the difference between years. PVGIS puts Congleton’s year-to-year spread at about 30 kWh per kWp, the widest of the six towns we ran. Add that to the average and a better-than-usual Congleton year makes about 939 kWh per kWp, level with an ordinary year in Northwich at 939. Over the life of the panels the good and poor years even out, and it is the average in the table above that matters. If a firm quotes a figure close to the Nantwich number, ask which location it used.
Shade the model leaves out
PVGIS allows for the hills but not for buildings, chimneys or trees. In the old town those matter more than the few per cent between towns. At midday on the shortest day the sun stands only about 13° above the horizon at Congleton’s latitude, so anything to the south of a roof throws a shadow about 4.2 times its own height. A chimney stack, a taller neighbour or a mill block can shade a slope for most of a winter day. In late June the midday sun is about 60° up and the same shadow is only 0.6 times the height, which is why a roof that looks clear in summer can still lose winter output. The months that vary most from year to year are the bright ones: April and July swing by about 16 and 16 kWh per kWp, December by about 4. Ask any firm to mark obstructions on its shade assessment.
Steep slate and the old town
If your roof is steeper than most, as some older houses are, that costs very little. A south slope at 45° makes 100% of the best Congleton figure and one at 50° makes 99%, so a tall Victorian roof is not a handicap. What decides an old-town roof is usually the route, not the output: whether the house sits in a conservation area, which slope faces the street and whether the building is listed. Conservation areas and listed buildings set those out.
A shared roof, divided
Converted mills and blocks of flats share one roof, so the output is shared too. As an example, a 10 kWp array on a south roof at 35° would make about 9,087 kWh a year; split between twenty flats, that is about 454 kWh each, before deciding whether it feeds the flats or the communal supply. Who can agree to it is covered on mill conversions and flats, and the price per kW on the cost page applies to a shared array as to a house.
Month by month
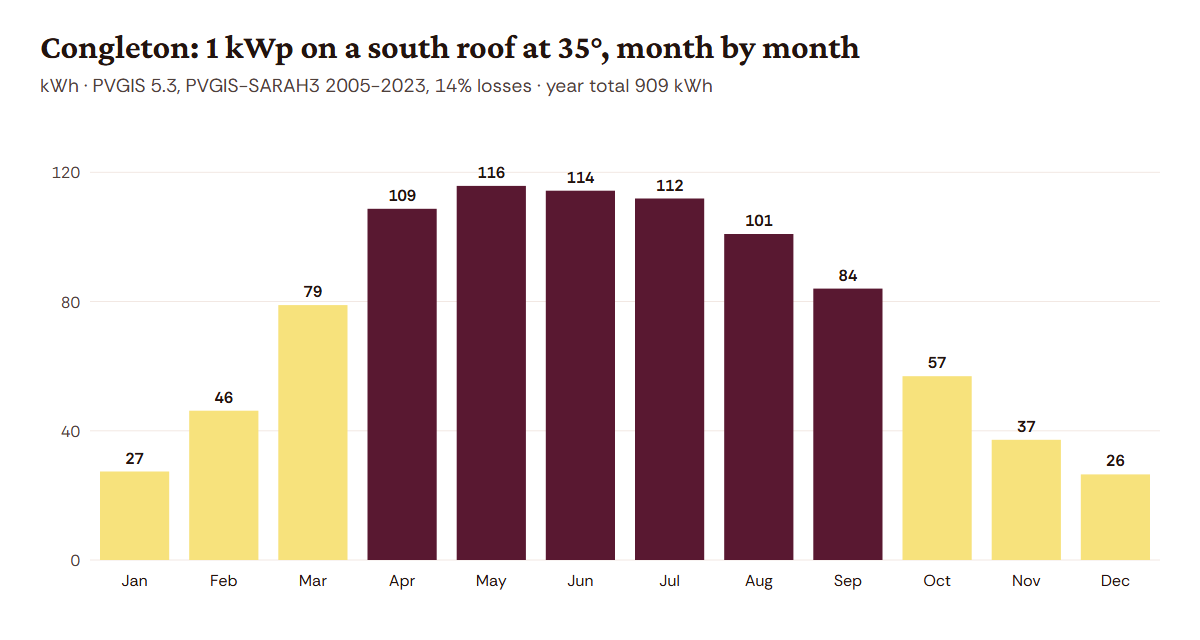
| Jan | Feb | Mar | Apr | May | Jun | Jul | Aug | Sep | Oct | Nov | Dec |
|---|---|---|---|---|---|---|---|---|---|---|---|
| 27 | 46 | 79 | 109 | 116 | 114 | 112 | 101 | 84 | 57 | 37 | 27 |
As everywhere in Cheshire, summer months make several times what winter months do. How much of the summer surplus the house uses decides much of the value: export and self-use, batteries.
Checking a quote
An MCS-certified firm has to give a performance estimate for your roof (MCS). Make sure it uses Congleton’s figures rather than a regional average. Exported units are paid under the SEG. The roof and route check multiplies it out, and east and west roofs covers split arrays.